Setup IntelliJ for development of Knora
Create an IntelliJ Project for the Knora API Server
- Download and install IntelliJ IDEA.
- Follow the installation procedure and install the
Scala plugin
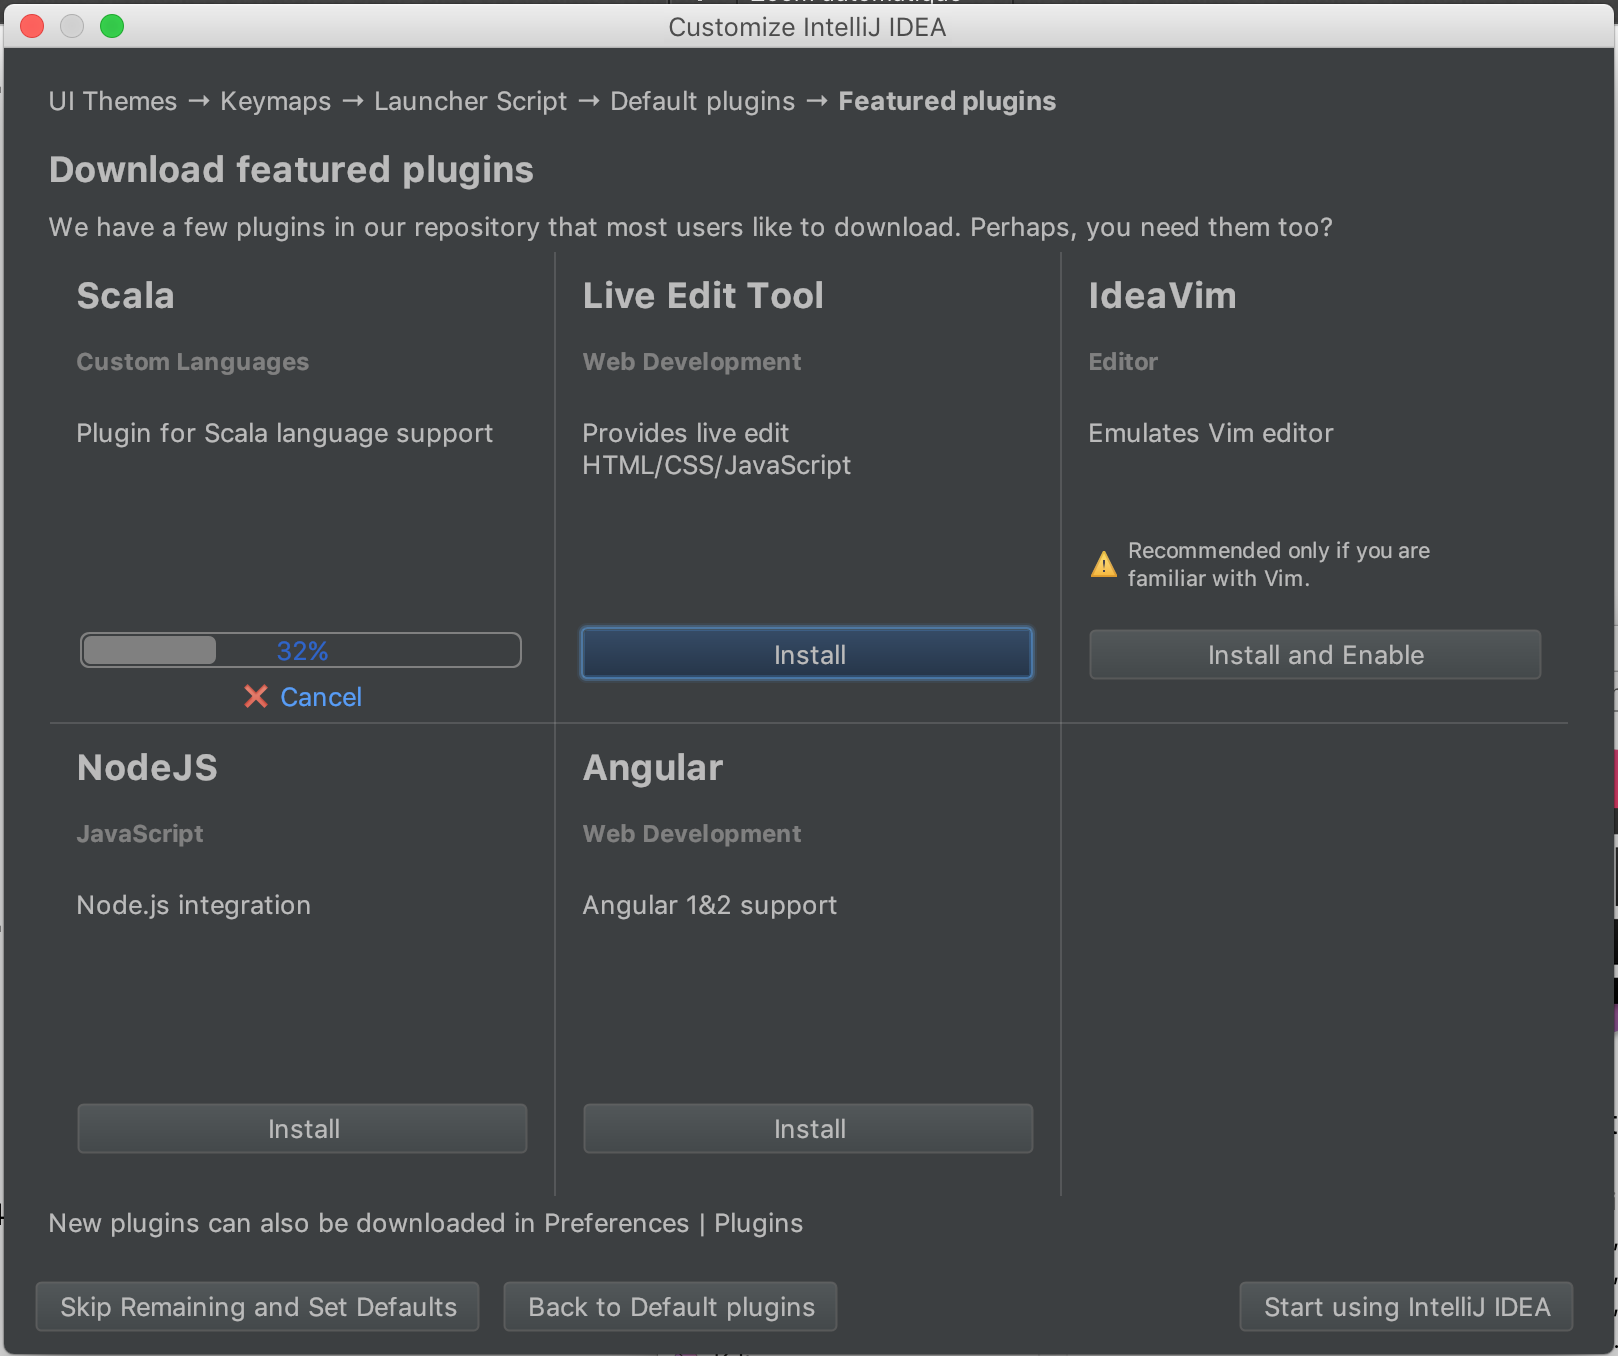
screenshot ‘Install Scala Plugin’
- Import the
webapidirectory in the Knora source tree:Import Project-> Choose the optionmodule SBT
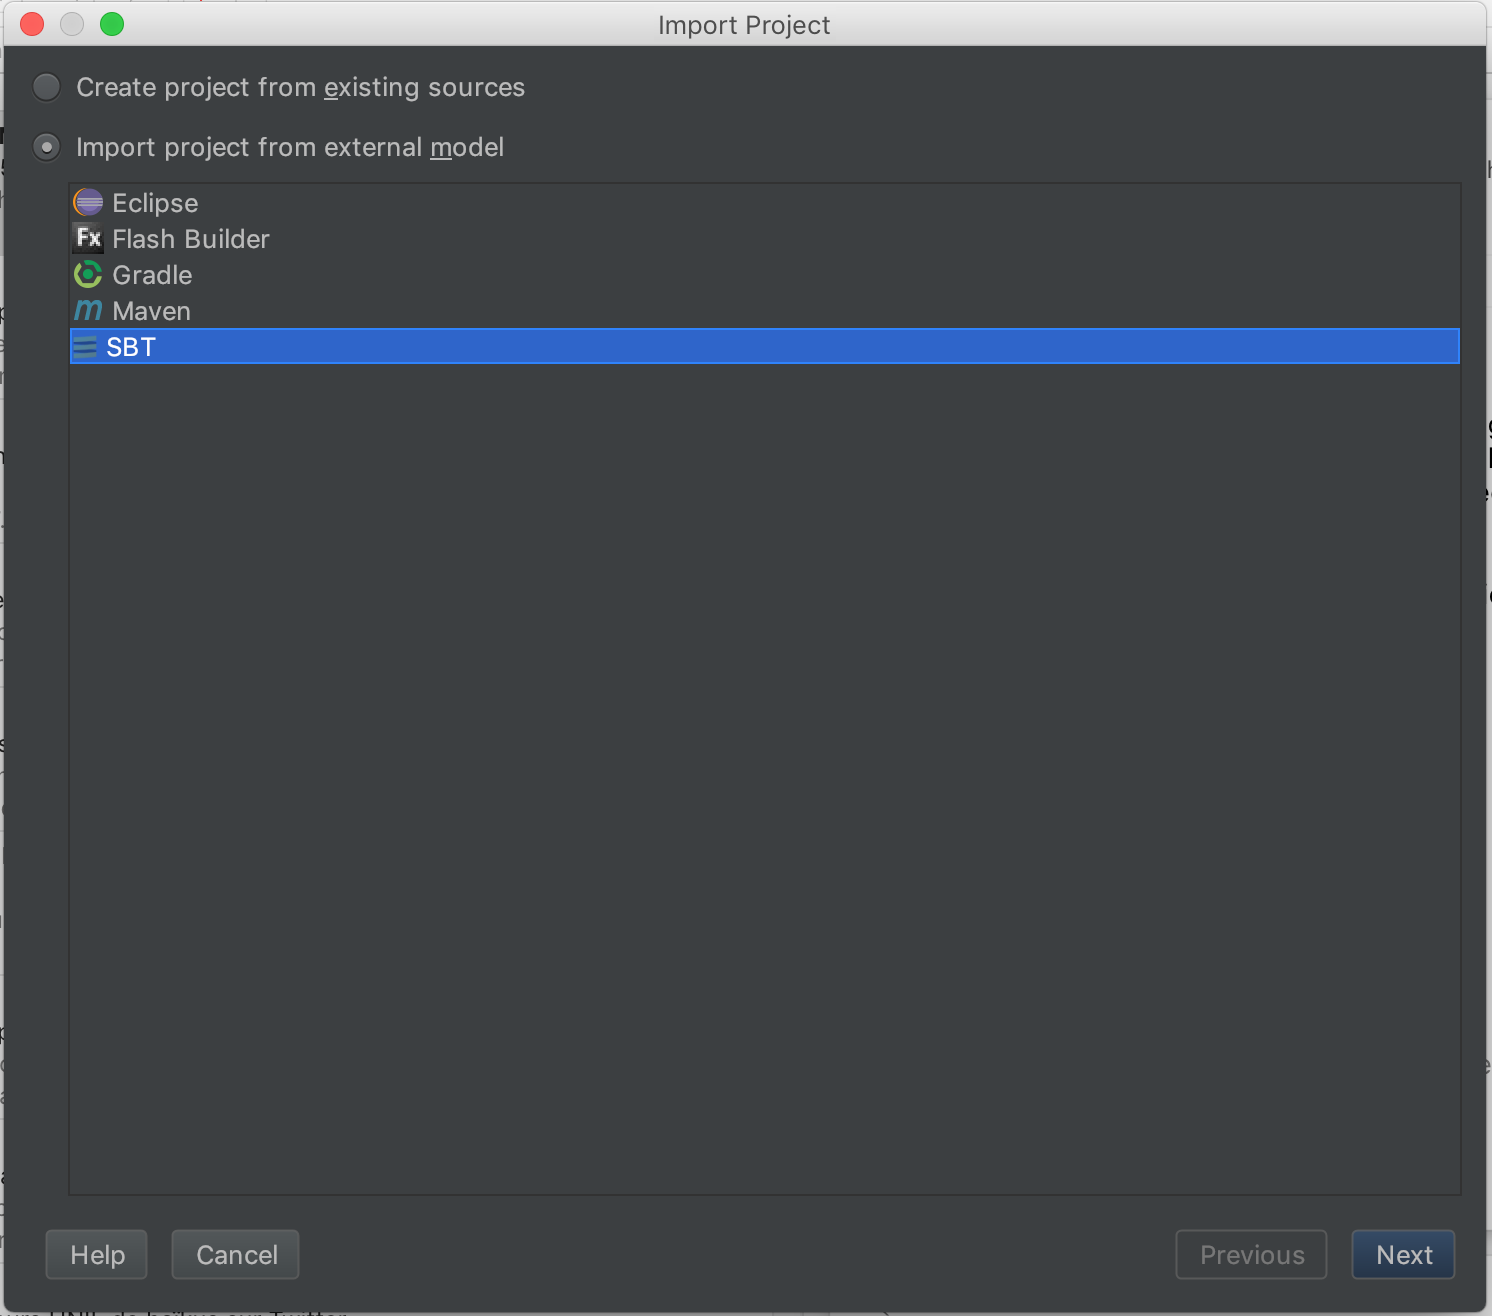
screenshot ‘import existing SBT project’
- make sure that the tab size is set correctly to 4 spaces (so you can use automatic code reformatting):
Preferences -> Code Style -> Scala:
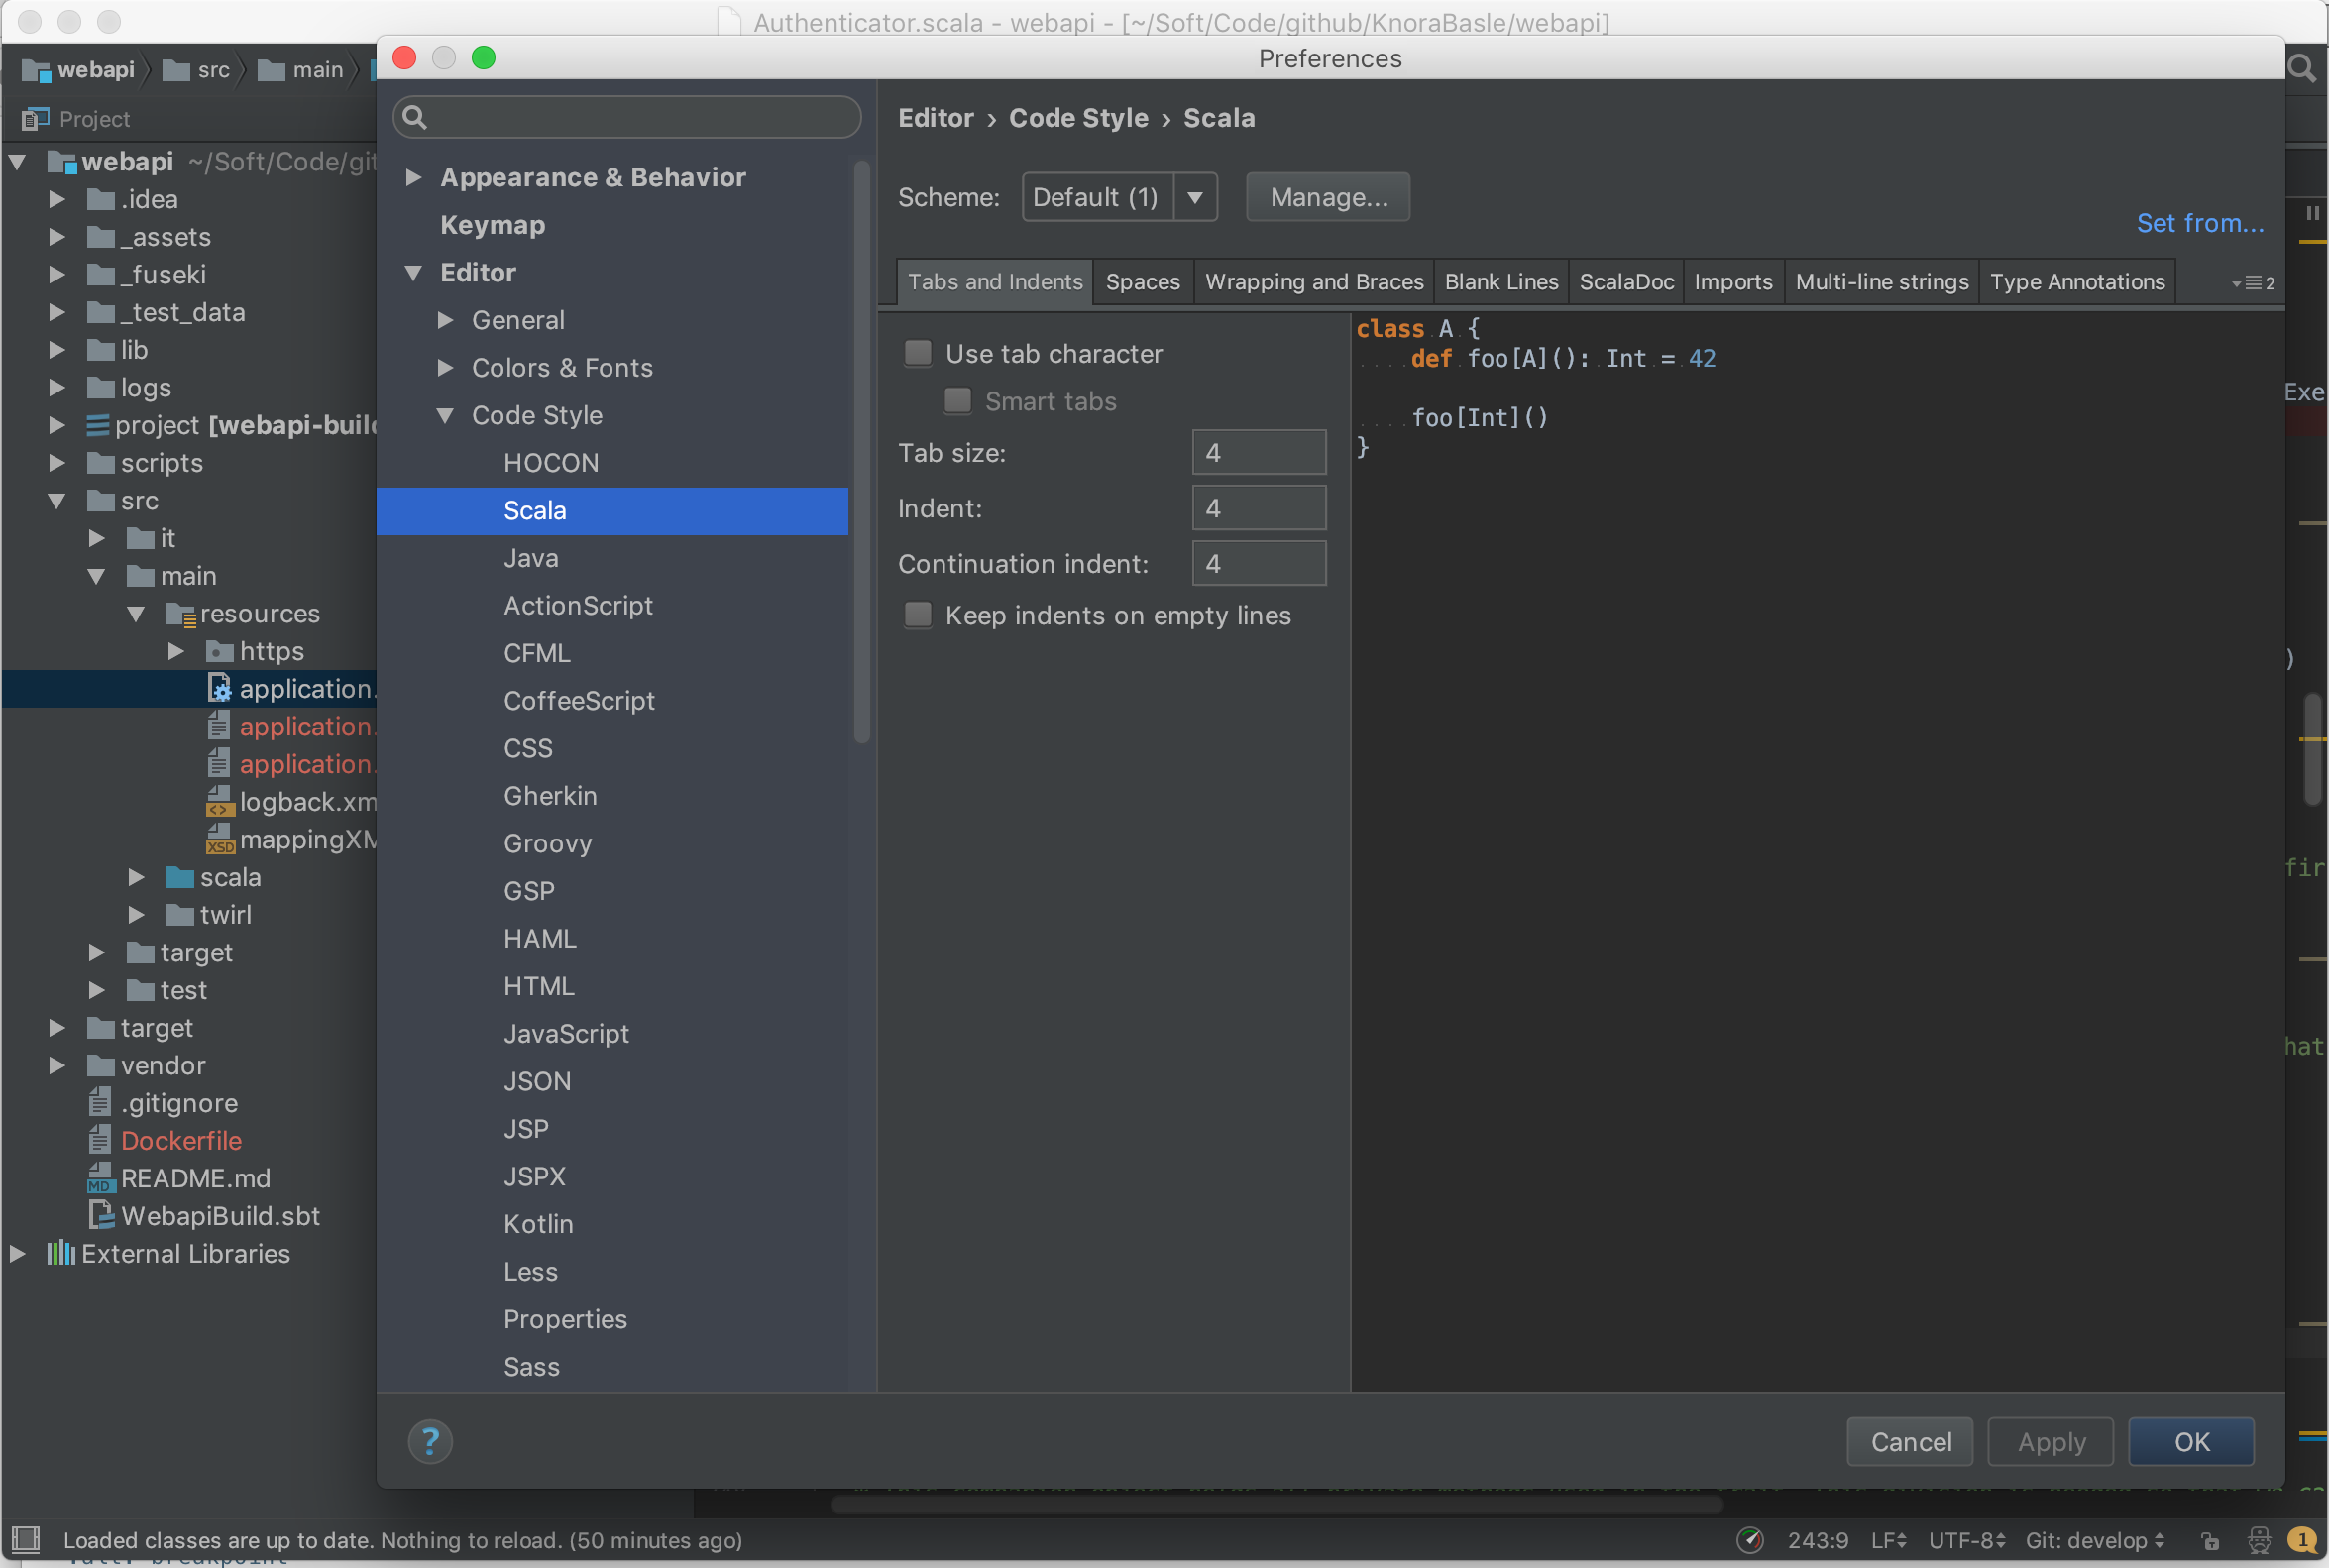
screenshot ‘setting tab size’
Twirl
By default, Intellij excludes some folders like the twirl template files. To include them, go to Project Structure and remove target/scala-2.1*/twirl from excluded folders.
Then Intellij will correctly resolve the references to the template files.
Use IntelliJ IDEA’s Debugger with the Knora API Server
- Create an application configuration:
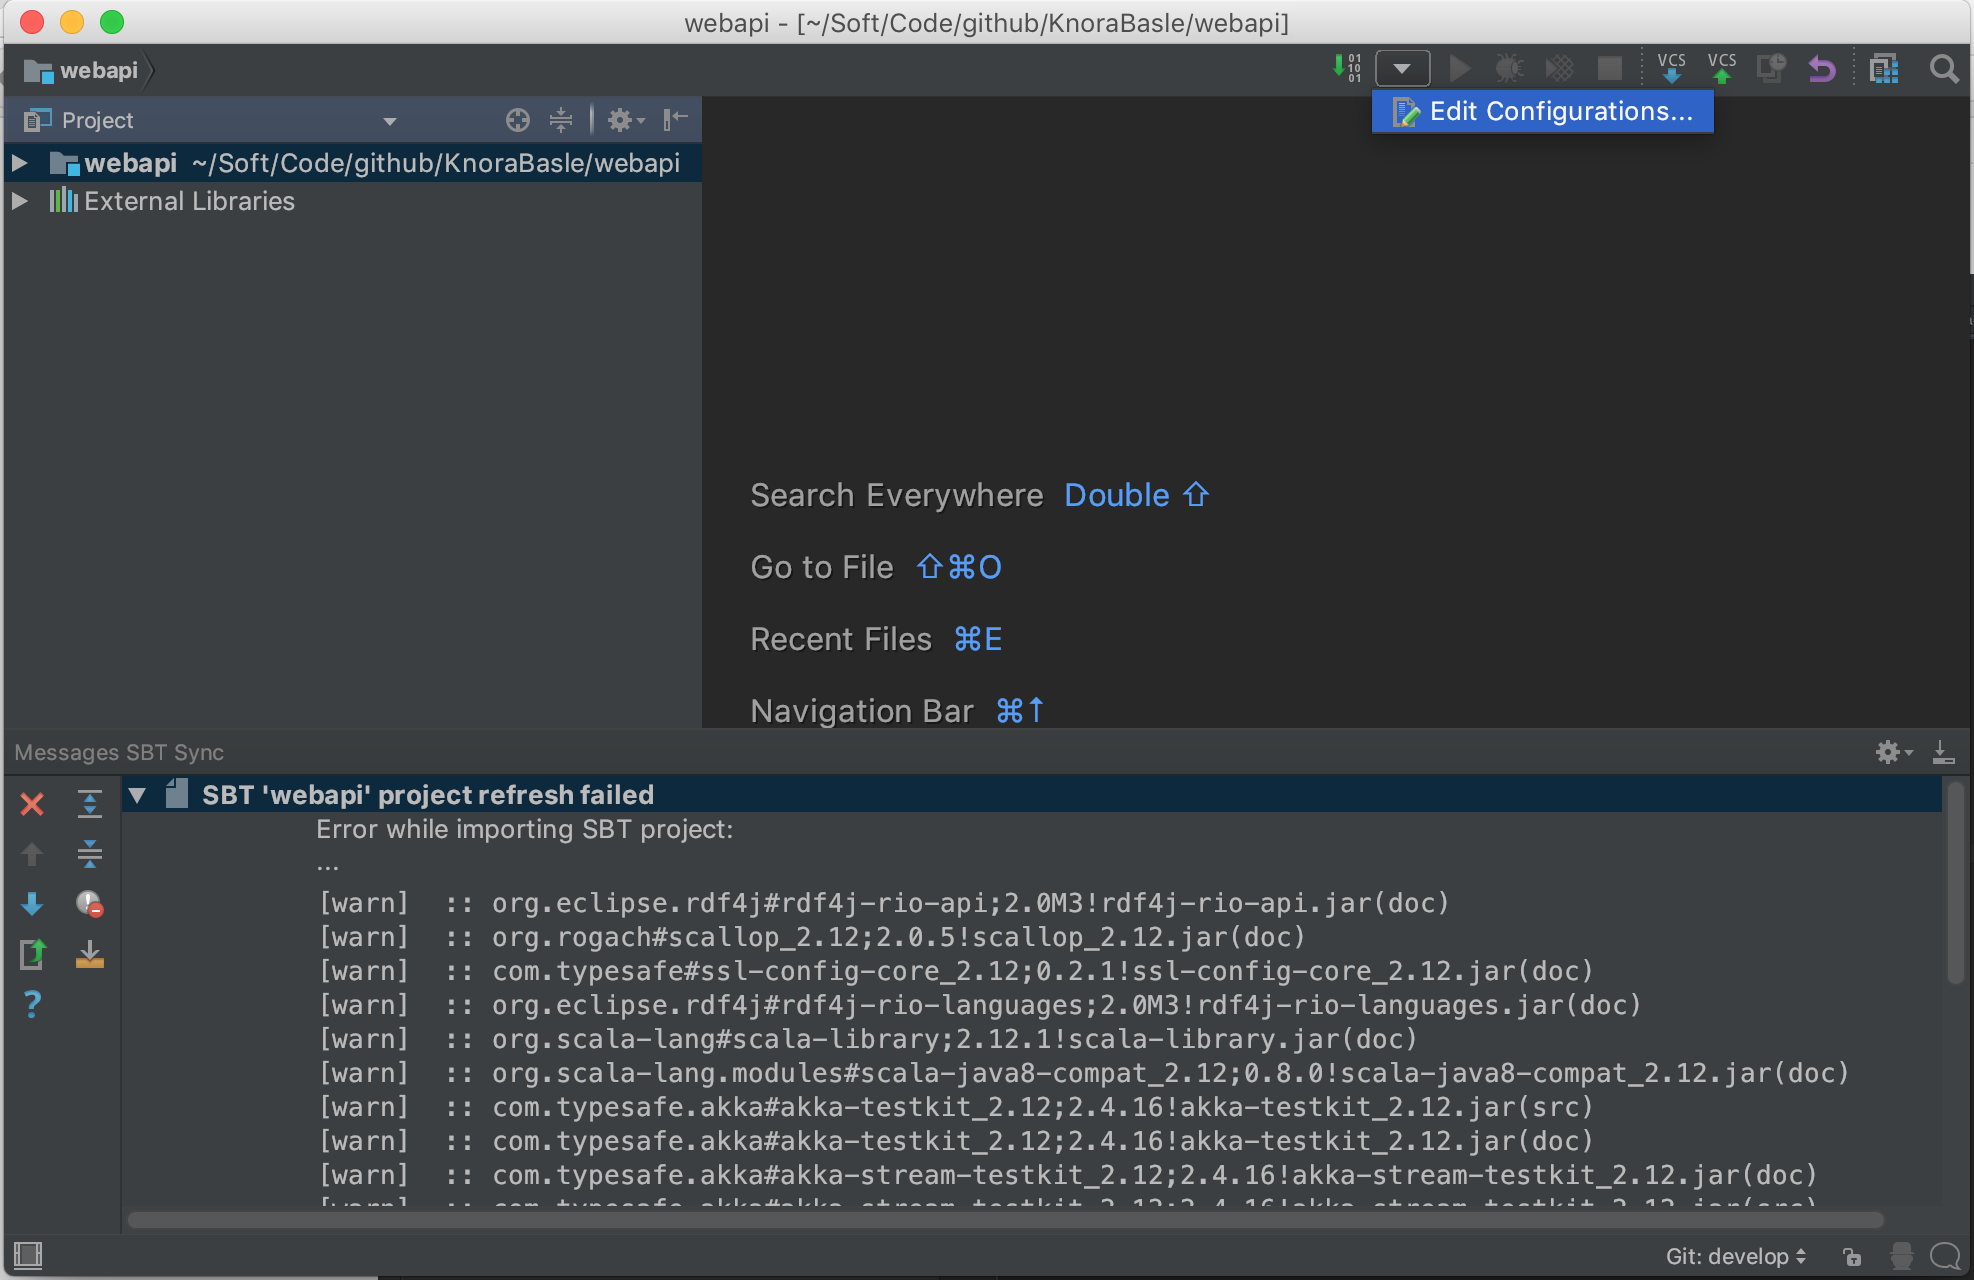
screenshot ‘edit application config’
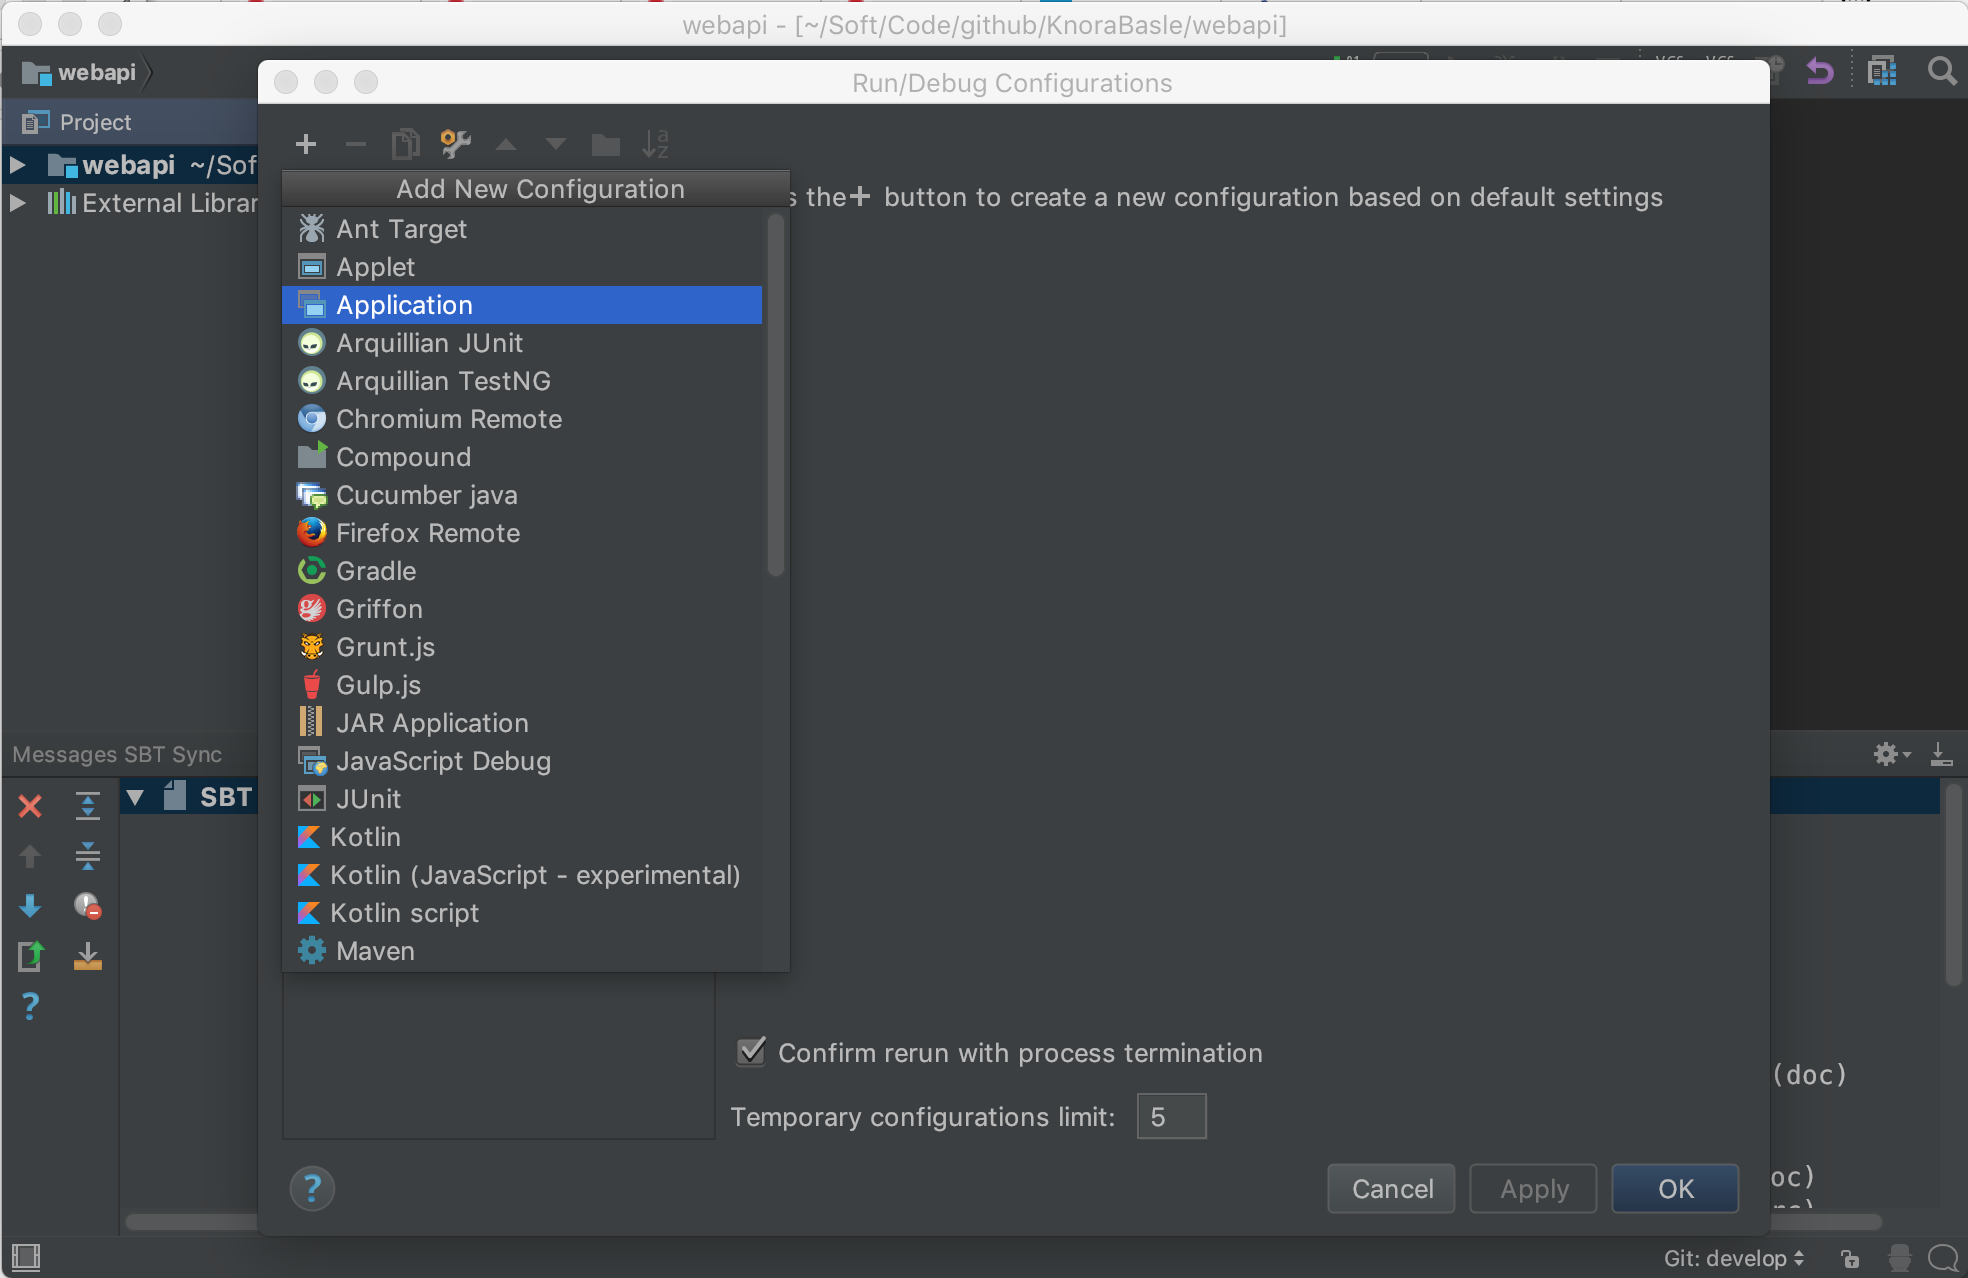
screenshot ‘create application configuration’
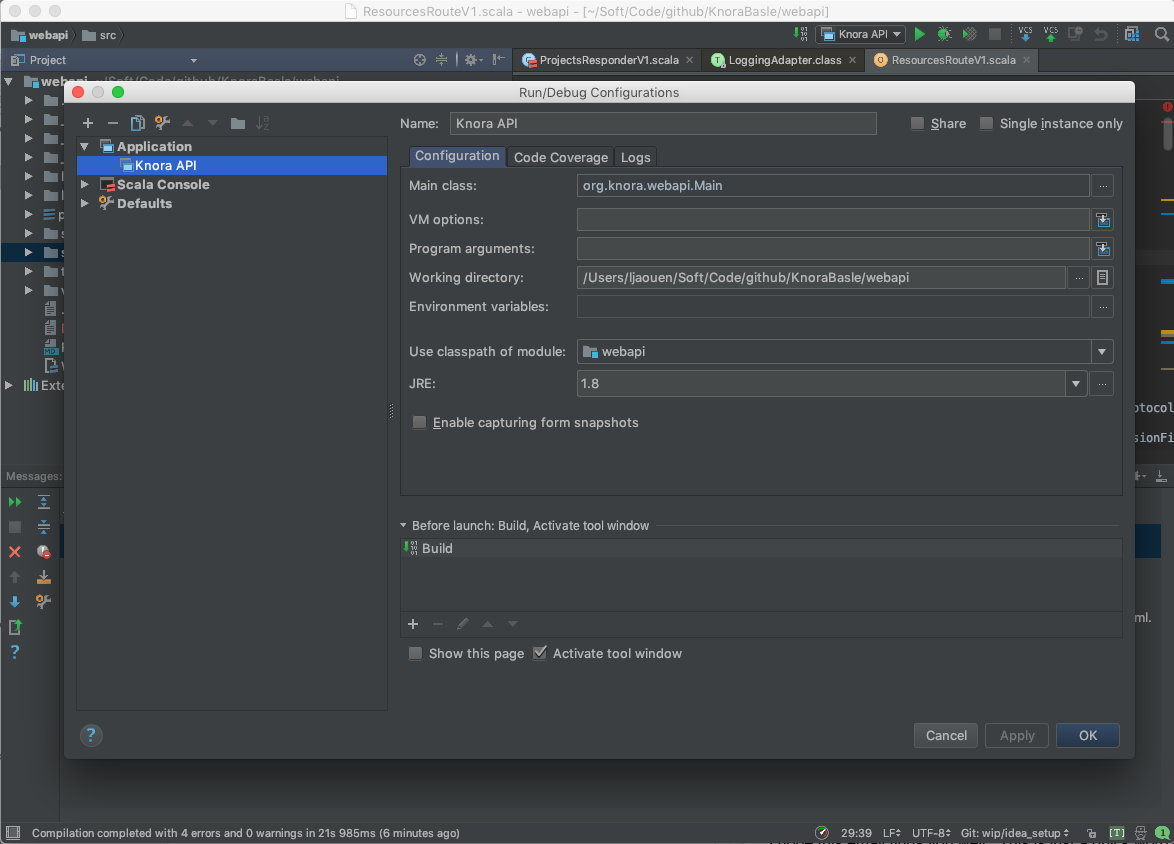
screenshot ‘change application configuration’
- Click on the debugging symbol to start the application with a debugger attached
screenshot ‘debug’
- Click on a line-number to add a breakpoint
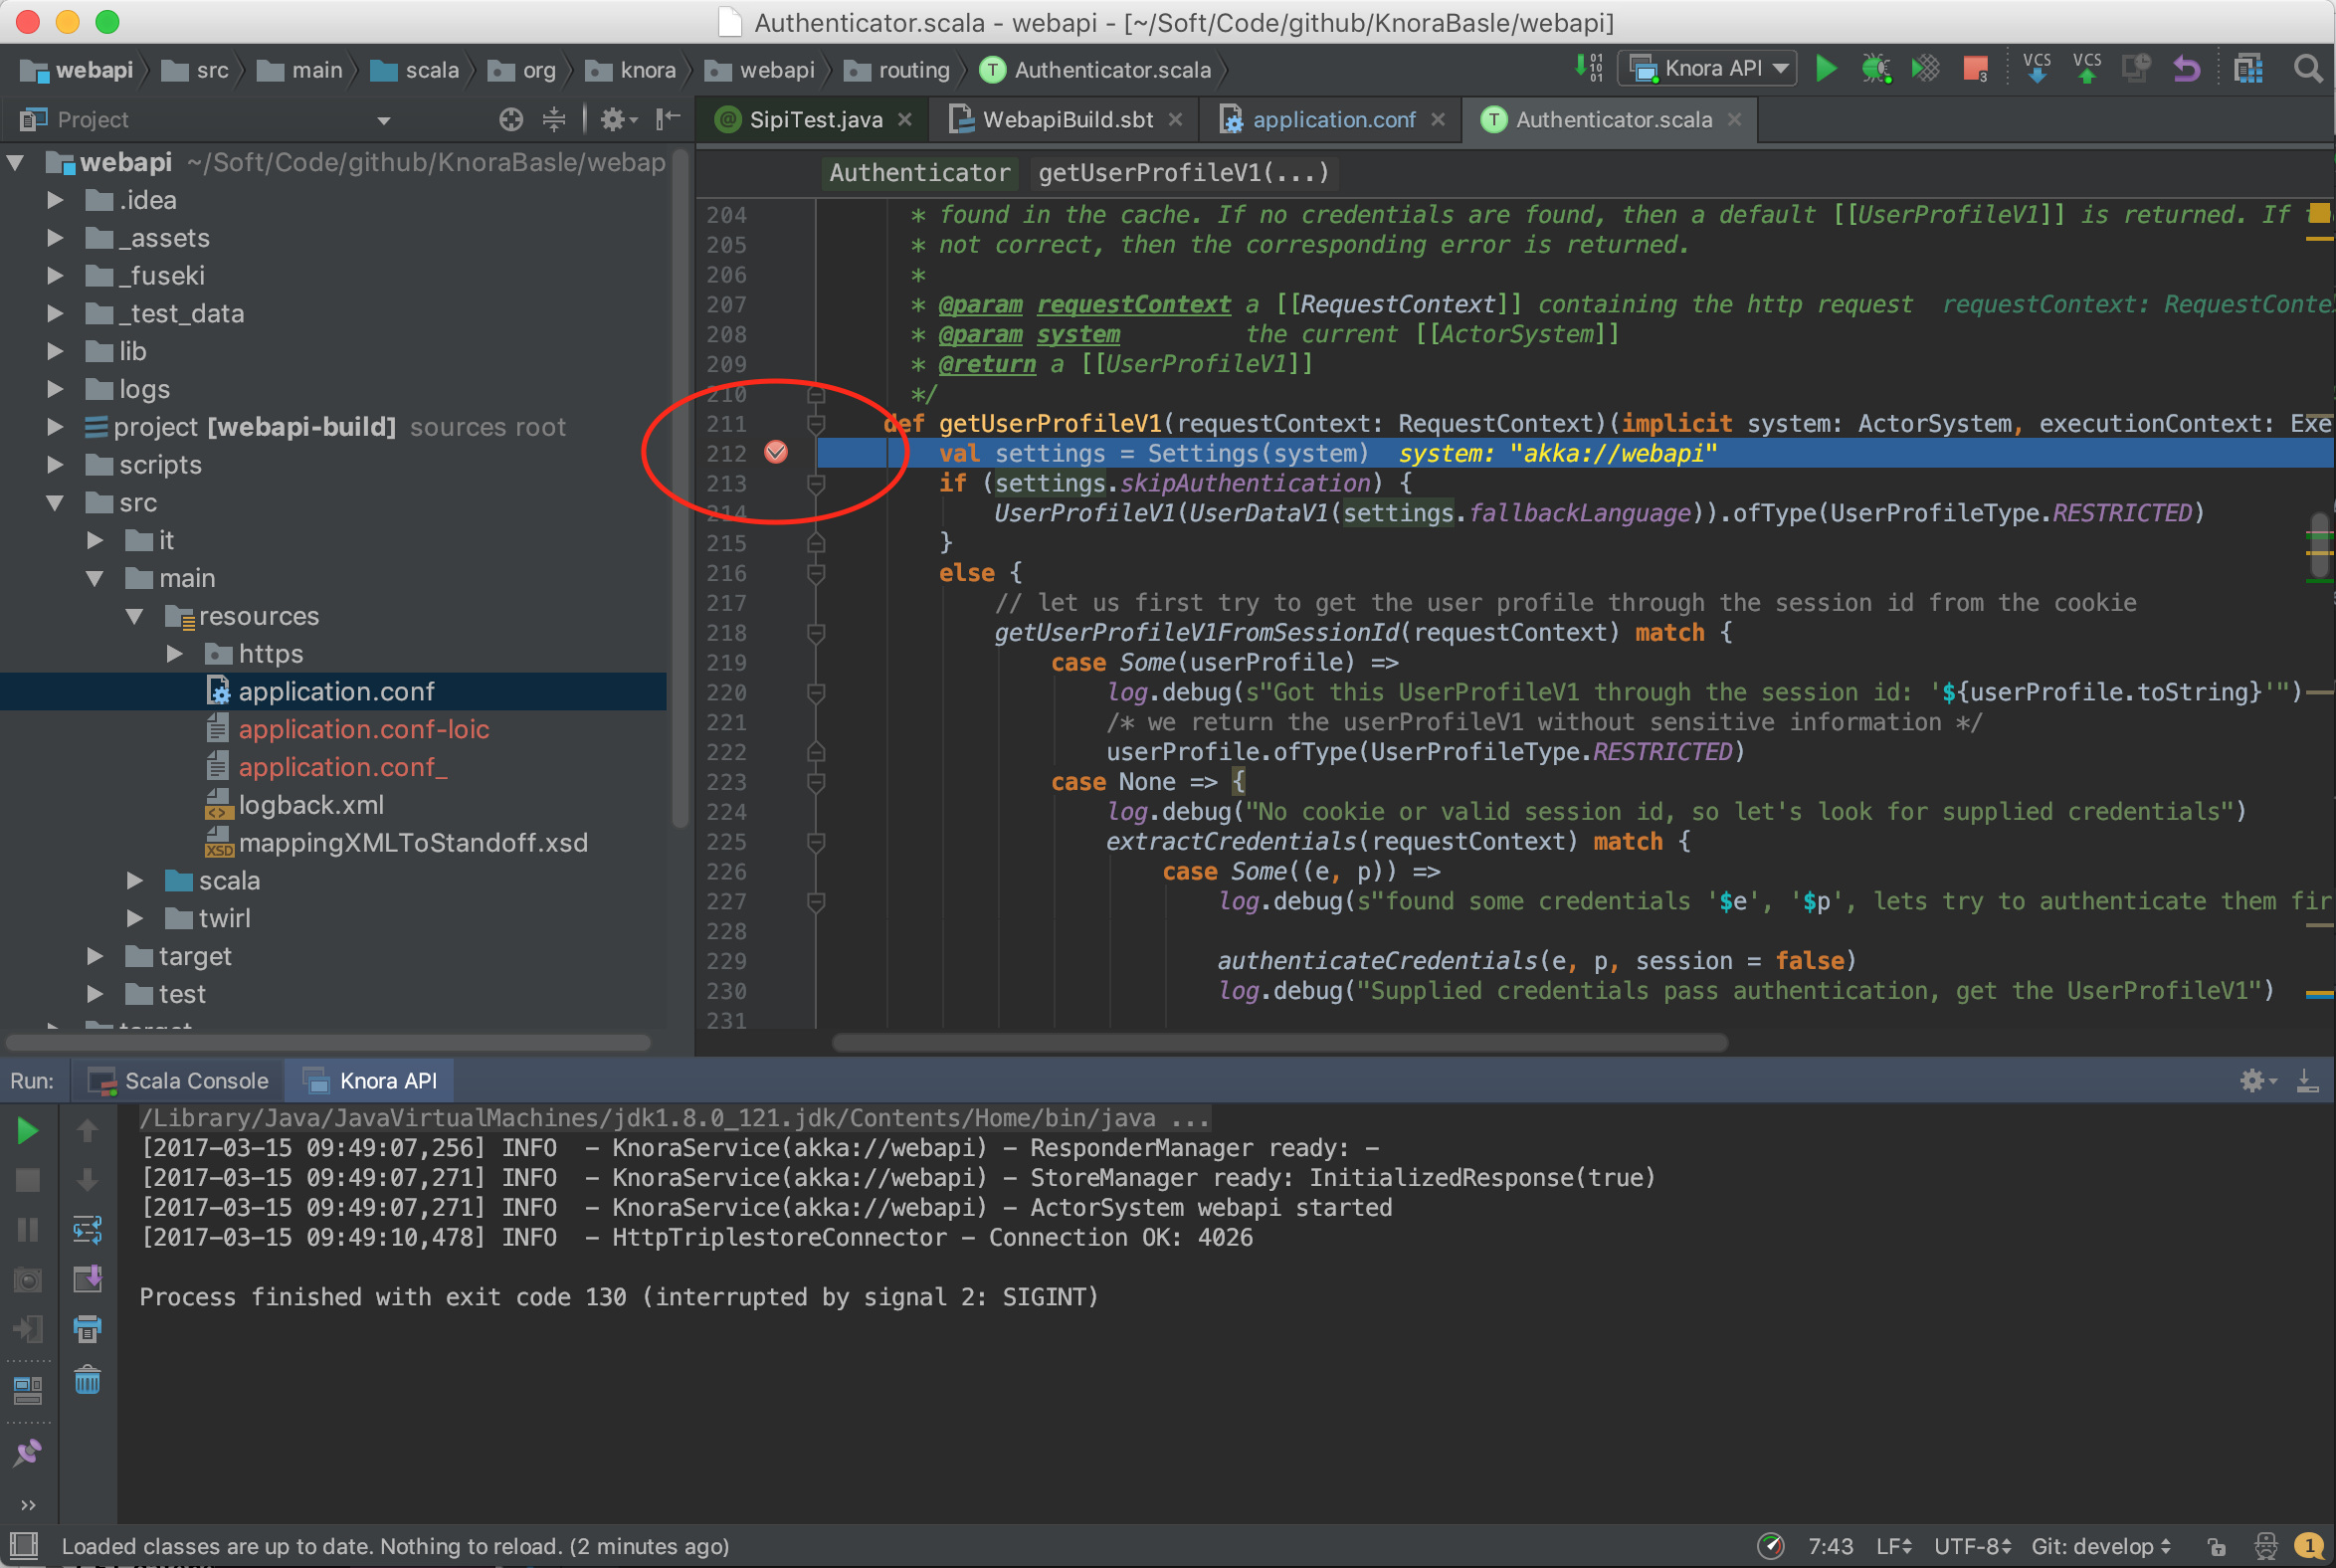
screenshot ‘set a breakpoint’
Profile Knora Using VisualVM in IntelliJ
First, download and install VisualVM.
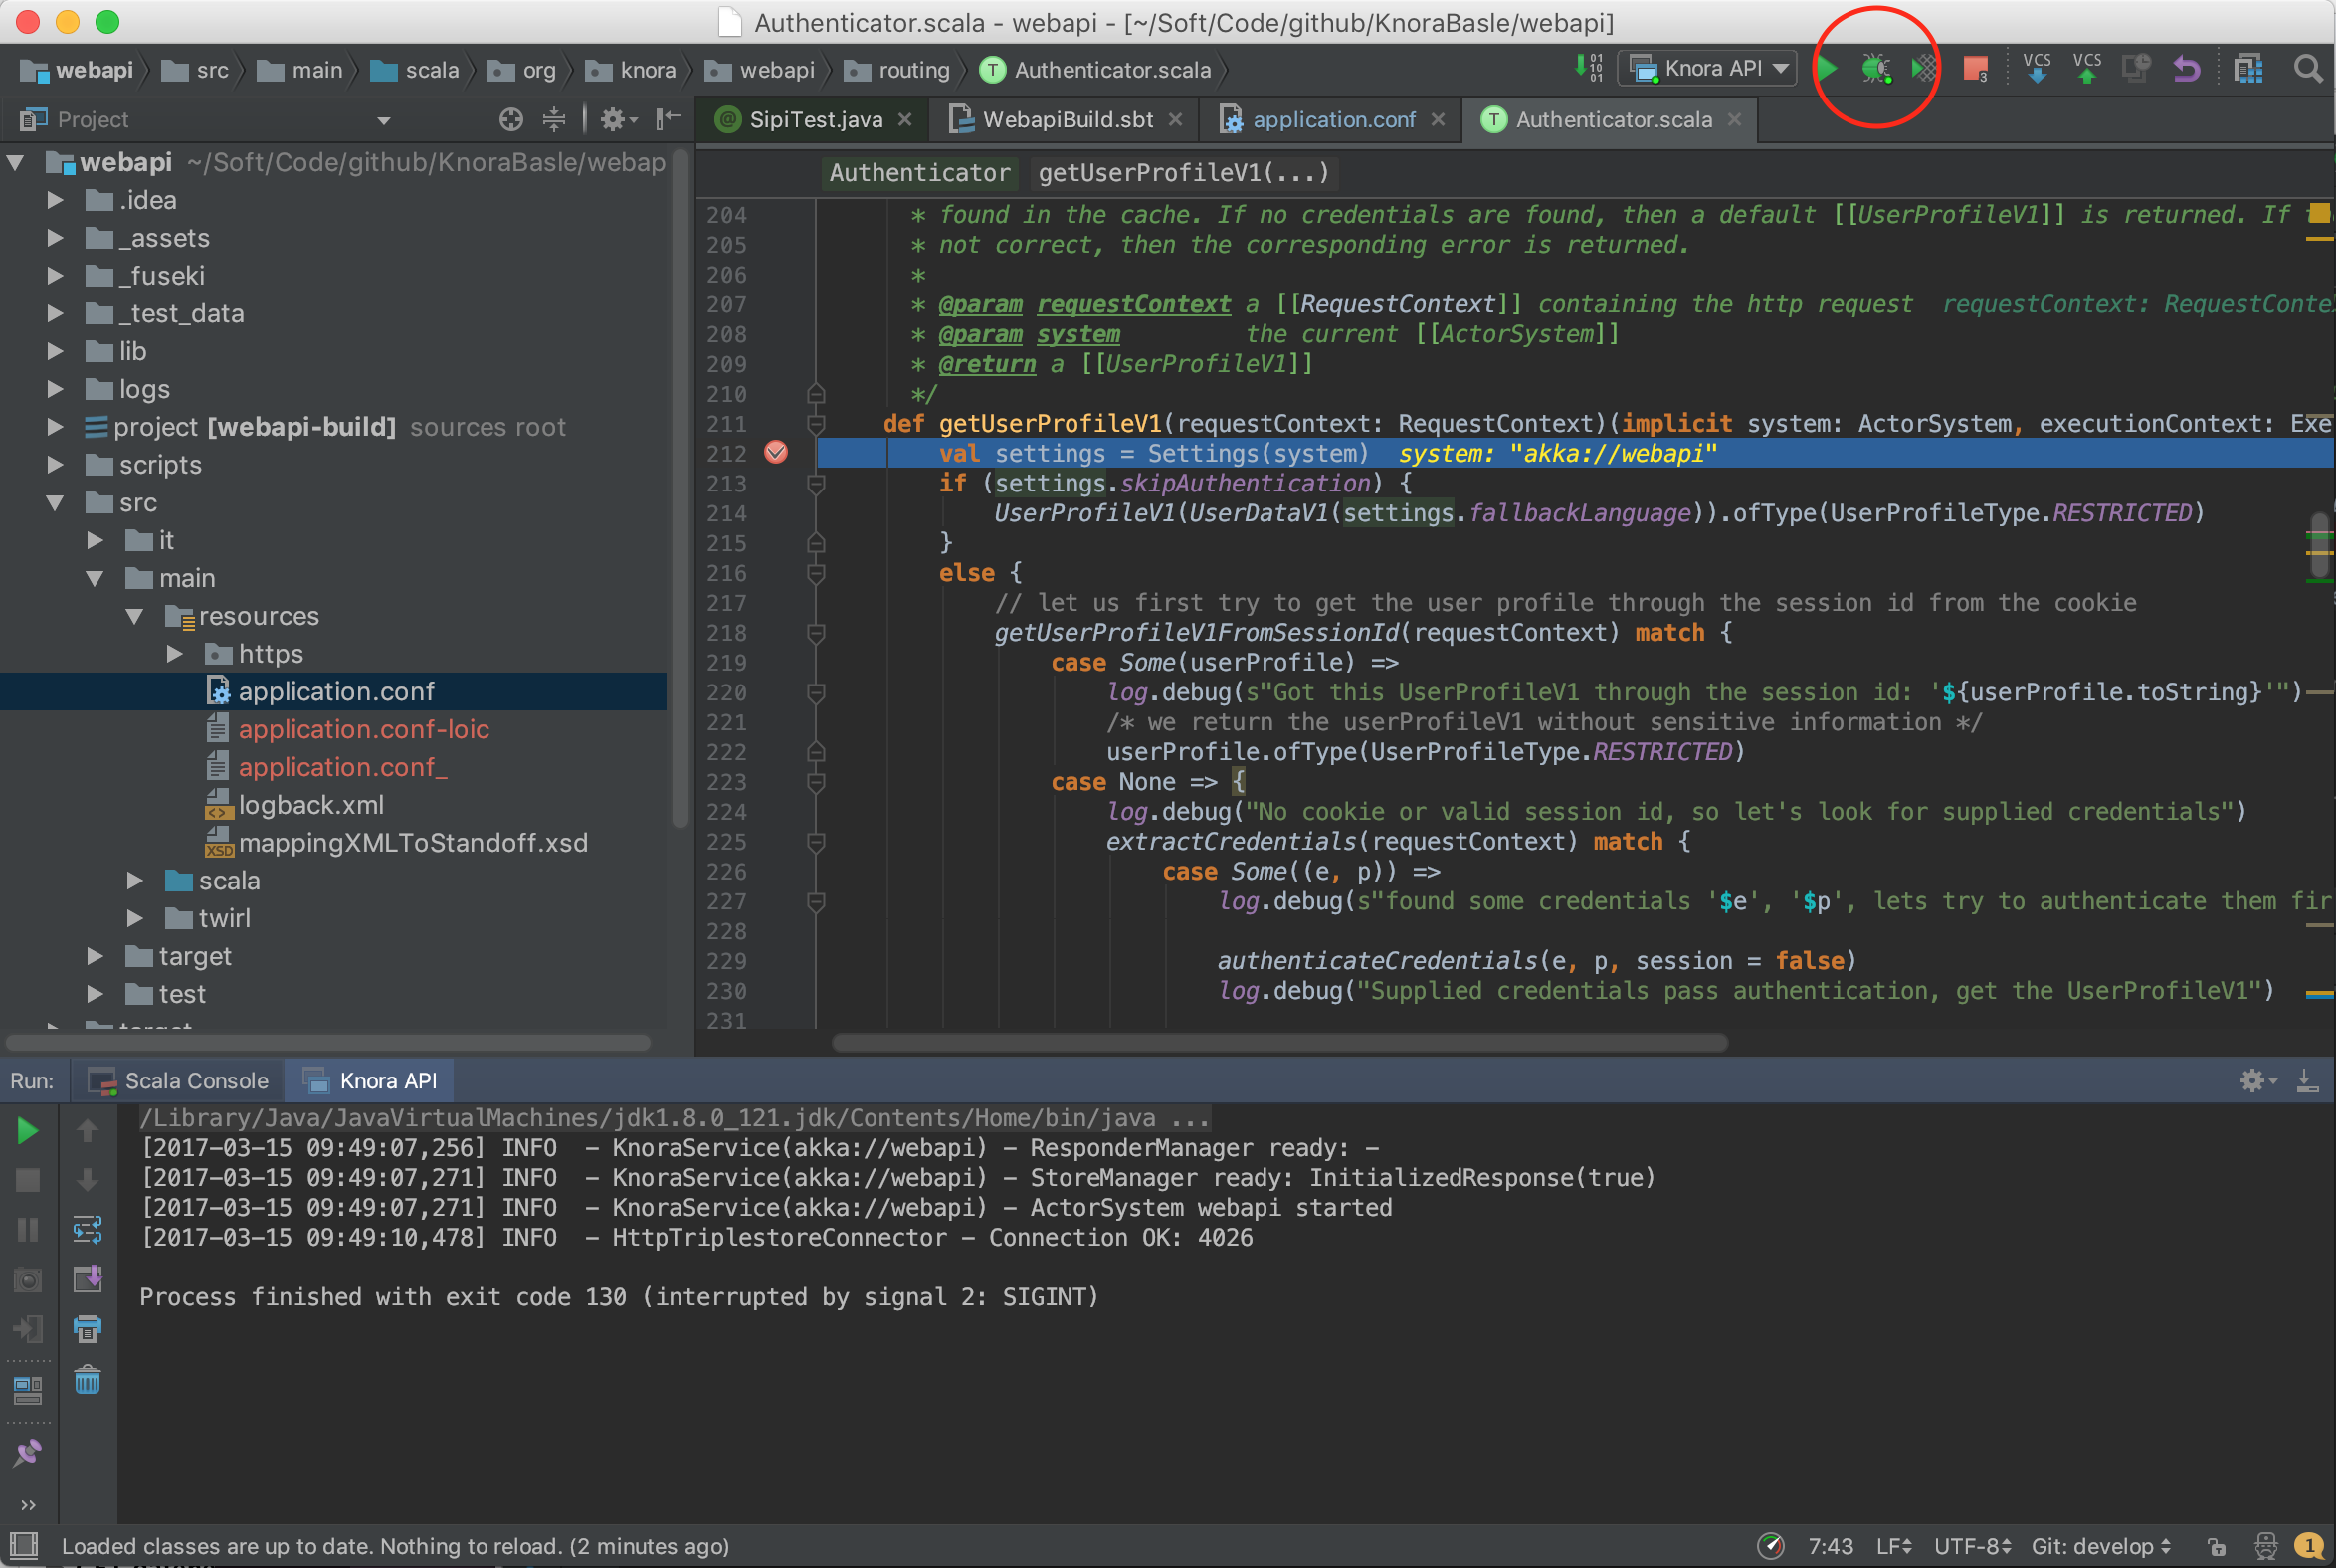
Then, in IntelliJ, under Preferences -> Plugins, search for the VisualVM Launcher, click on “Search in repositories”, install the plugin, and restart IntelliJ. IntelliJ’s toolbar should now contain a button with a green triangle on an orange circle, with the tooltip “Run with VisualVM”:
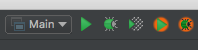
screenshot ‘Run with VisualVM button’
You can use this button to run the class org.knora.webapi.Main and profile it in VisualVM.
The first time you do this, IntelliJ will ask you for the path to the VisualVM executable.
On macOS this is /Applications/VisualVM.app/Contents/MacOS/visualvm.
When VisualVM starts, it will open a window like this:
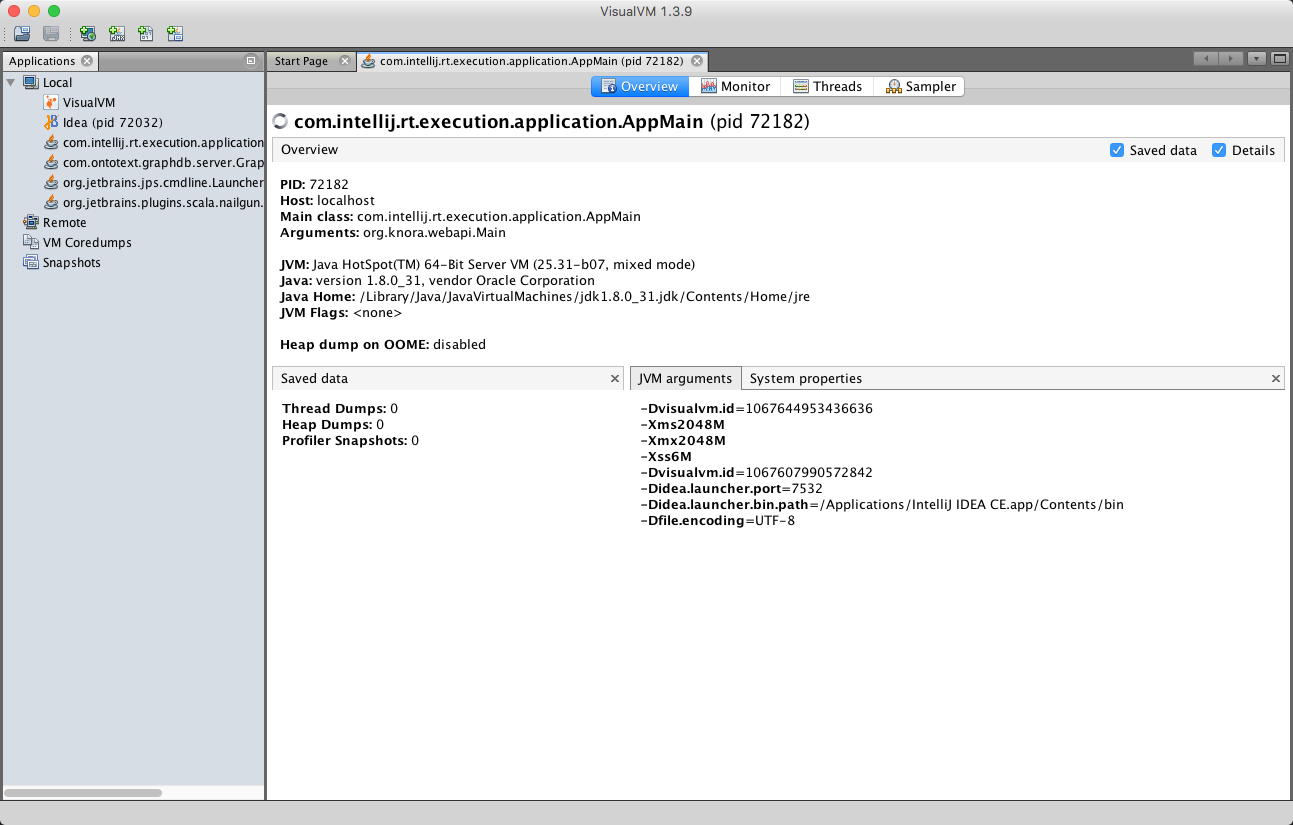
screenshot ‘VisualVM overview’
To use the profiler, click on the “Sampler” tab, then on the “CPU” button:
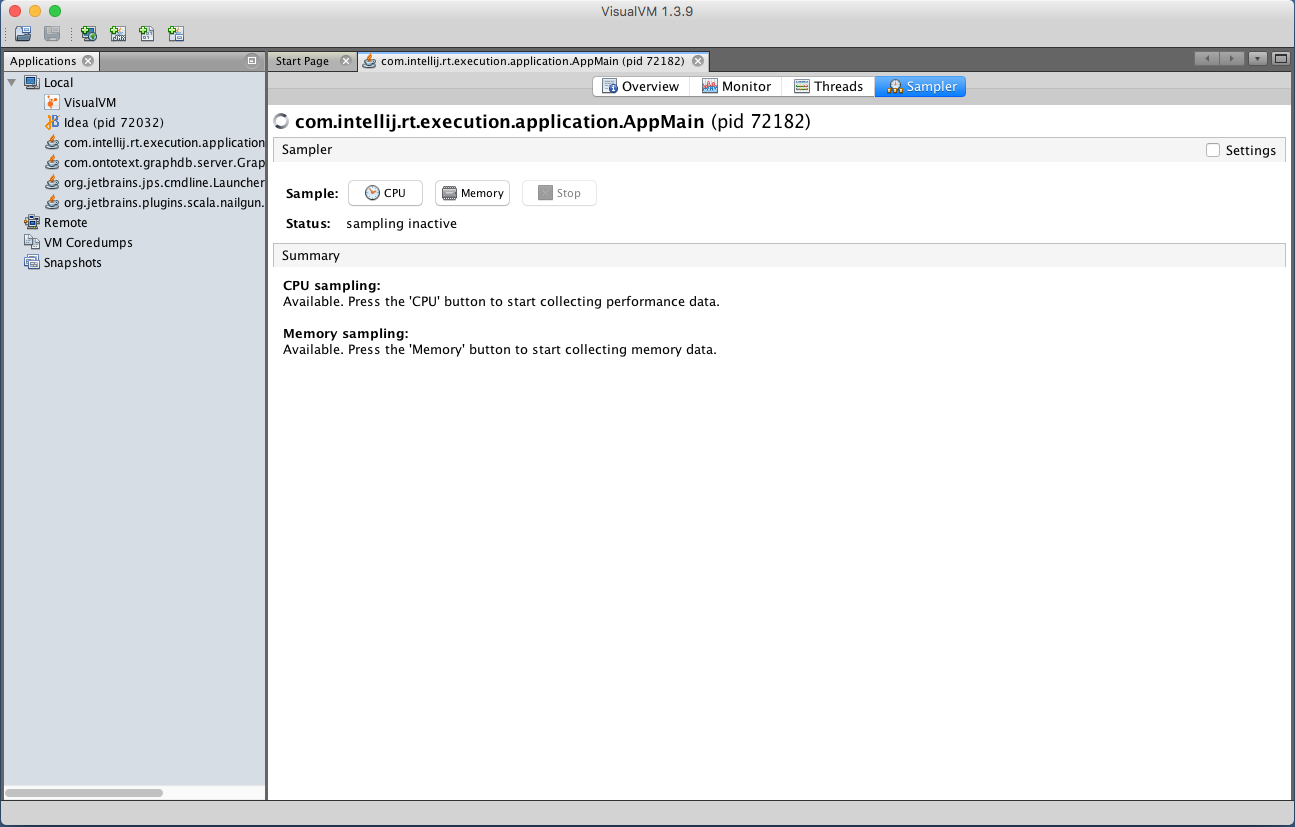
screenshot ‘VisualVM sampler’
Now run some Knora API operations that you’re interested in profiling, preferably several times to allow the sampler to collect enough data. Then click on the “Snapshot” button:
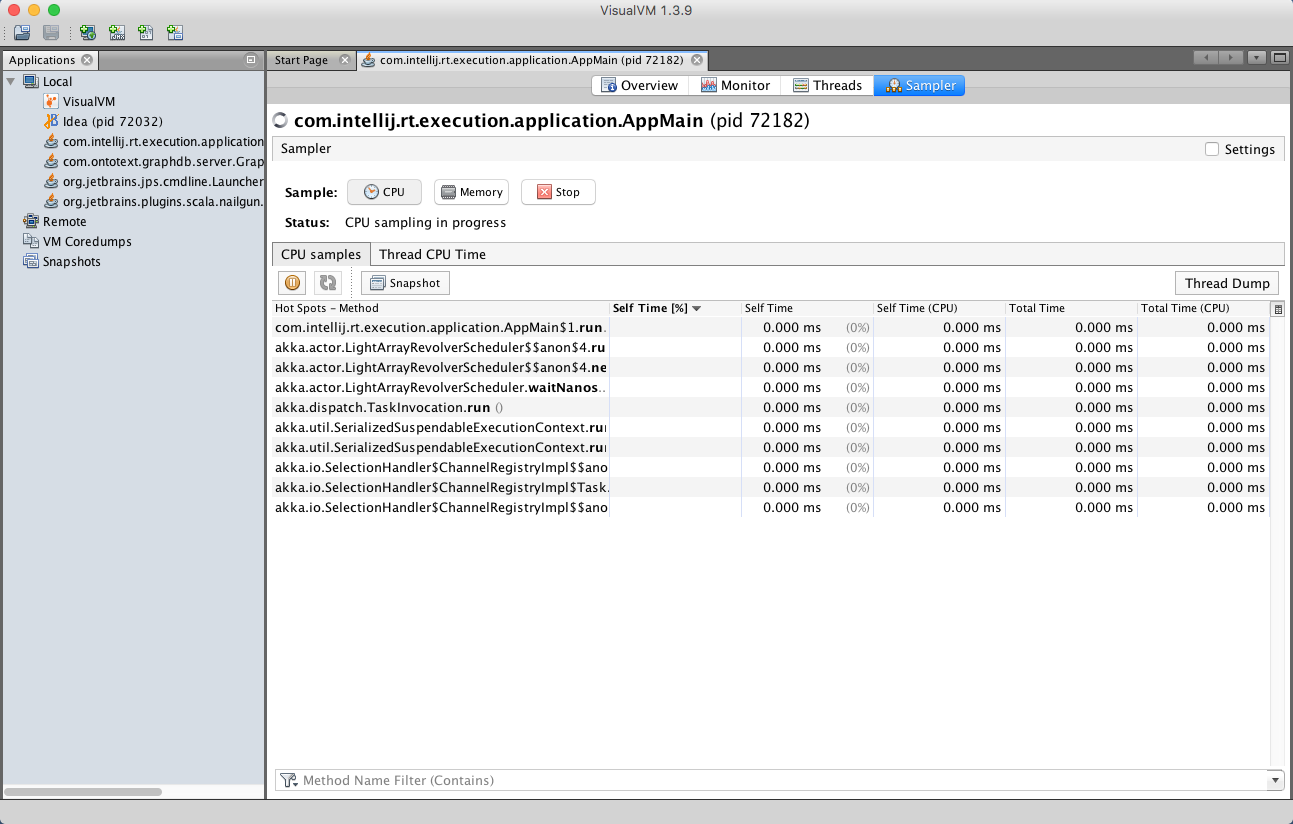
screenshot ‘VisualVM snapshot button’
In the snapshot, you’ll see a list of threads that were profiled:
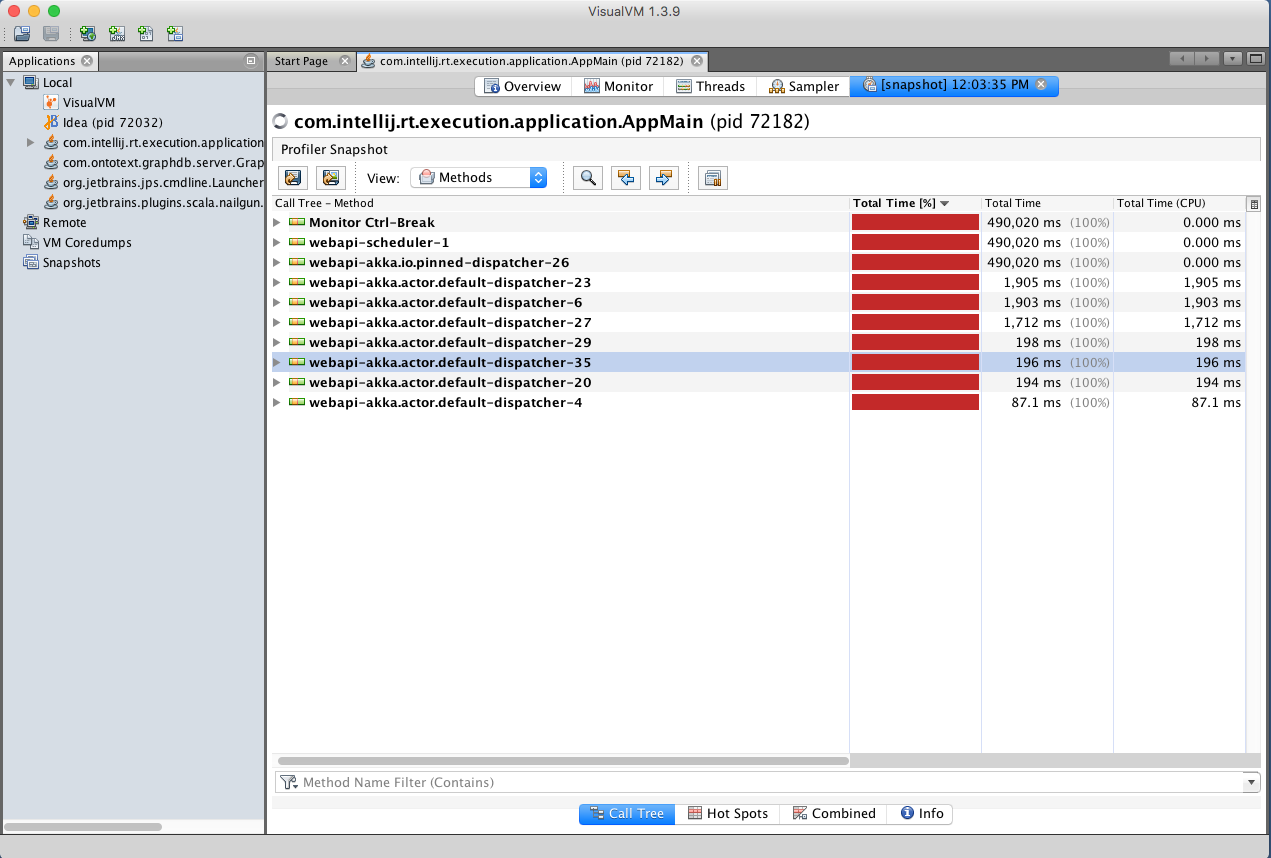
screenshot ‘VisualVM snapshot’
You can then browse the call tree for each thread, looking for Knora method calls, to see the total time spent in each method:
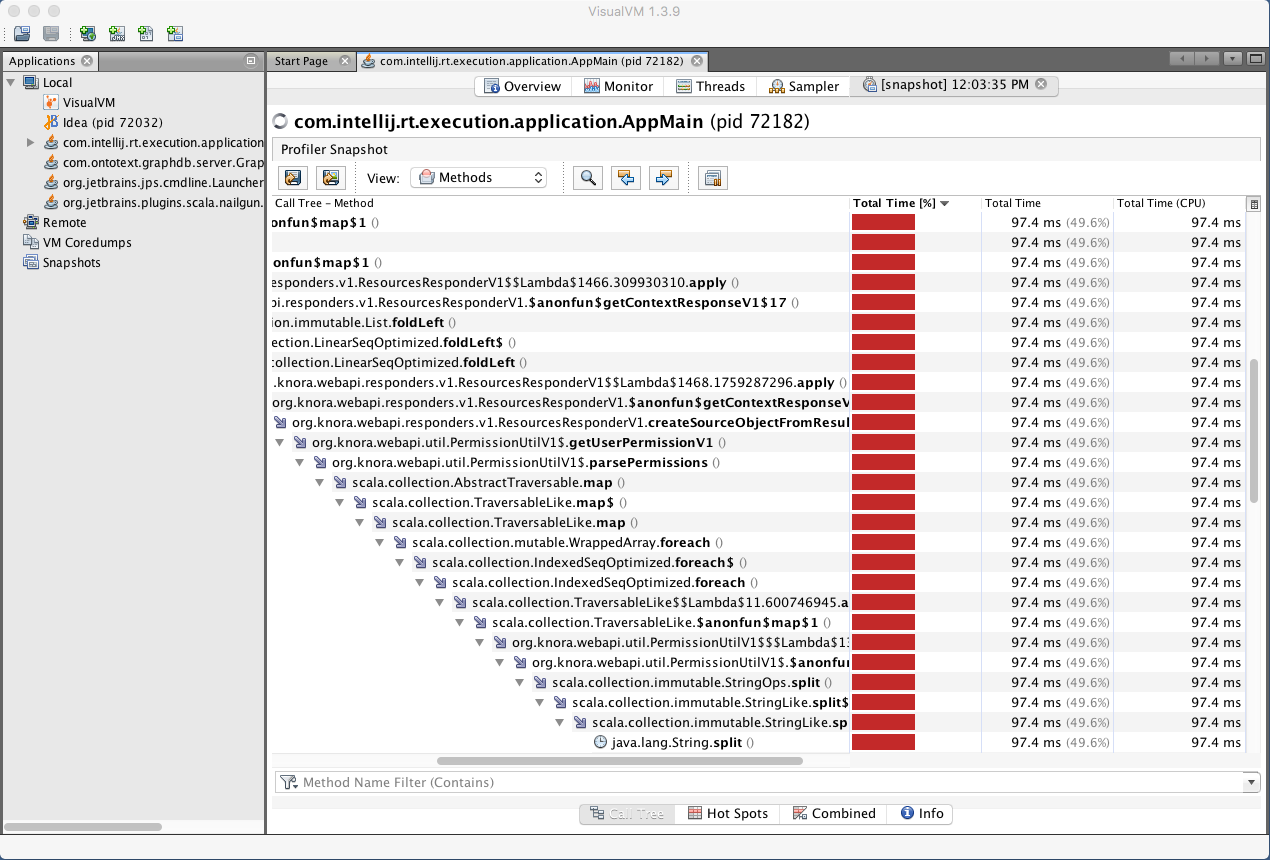
screenshot ‘VisualVM call tree’